Observability
Firecube is a batch CLI, not a long-running service. One firecube ingest
command emits signals while it runs and flushes what it can before the process
exits.
Start with metrics, then logs, then traces:
- Metrics answer how much work happened and how the run performed.
- Logs explain what happened during the command.
- Traces show where time was spent across phases and batches.
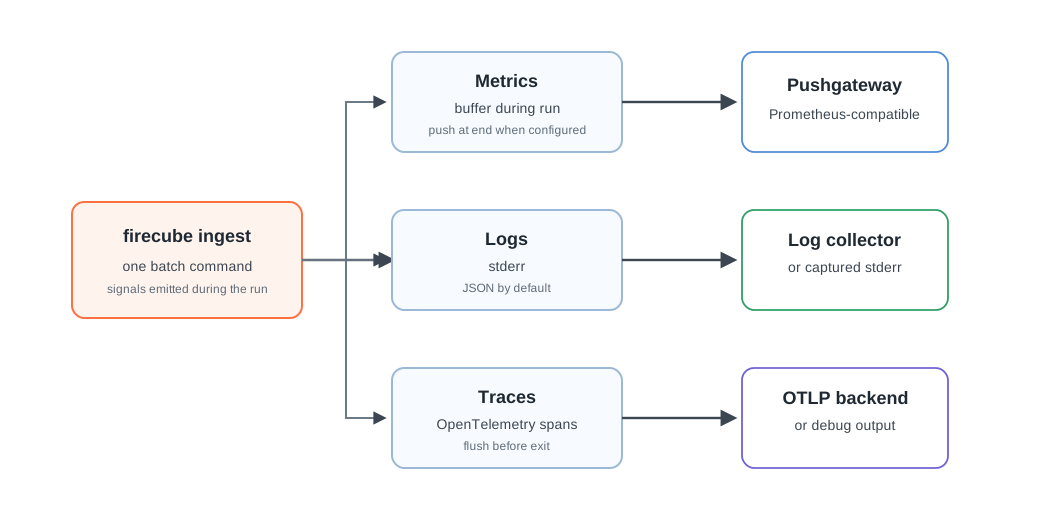
Batch Model
Firecube does not expose a /metrics endpoint. A scrape interval can miss a
short command, so Firecube uses a batch-friendly model:
- metrics are buffered during the command and pushed to a Prometheus Pushgateway at the end when configured;
- logs are written as the command runs;
- traces are recorded while spans are active and flushed before exit.
ChunkManager is separate from observability. Use ChunkManager operations when you need to inspect resume state, stuck runs, claims, or cleanup records.
Where To Start
Use Metrics when you need run counts, durations, storage errors, or product-specific counters and gauges.
Use Logs when you need command events, error messages, debug output, or machine-readable stderr.
Use Traces when you need timing across phases, batches, workers, or external orchestrator jobs.
Plugin authors emit product-specific metrics and spans through
ctx.telemetry. See Plugin Observability for the
plugin contract.
Next Steps
- Metrics — configure Pushgateway metrics and plugin metric emission
- Logs — understand stdout/stderr and JSON log fields
- Traces — configure OTLP tracing and run correlation
- Observability Reference — complete metric, environment-variable, label, and span reference
- Weather CSV: Observability — add one metric to the Weather CSV tutorial plugin